Explore the New DataClarity 2023.6: Dataset Metadata Validation, API Support for SQL Select Queries Datasets, Expanded Geospatial Mapping, and more

- Strengthen data integrity by providing dataset stewards with robust metadata validation capabilities, ensuring seamless and effortless data accuracy.
- Elevate your embedded analytics with the new Individual Widget Embed URLs. Now, embed not just entire storyboards or pages, but also specific widgets or charts, for a more streamlined and customized analytical experience.
- Harness the improved API that allows developers to directly execute SQL queries in datasets, supporting multiple programming languages for advanced data analysis and reporting.
- Enhance your insight into dataset usage with improved stats notifications. Now featuring detailed user query counts and visual bar charts, enriched with user avatars for a more personalized experience.
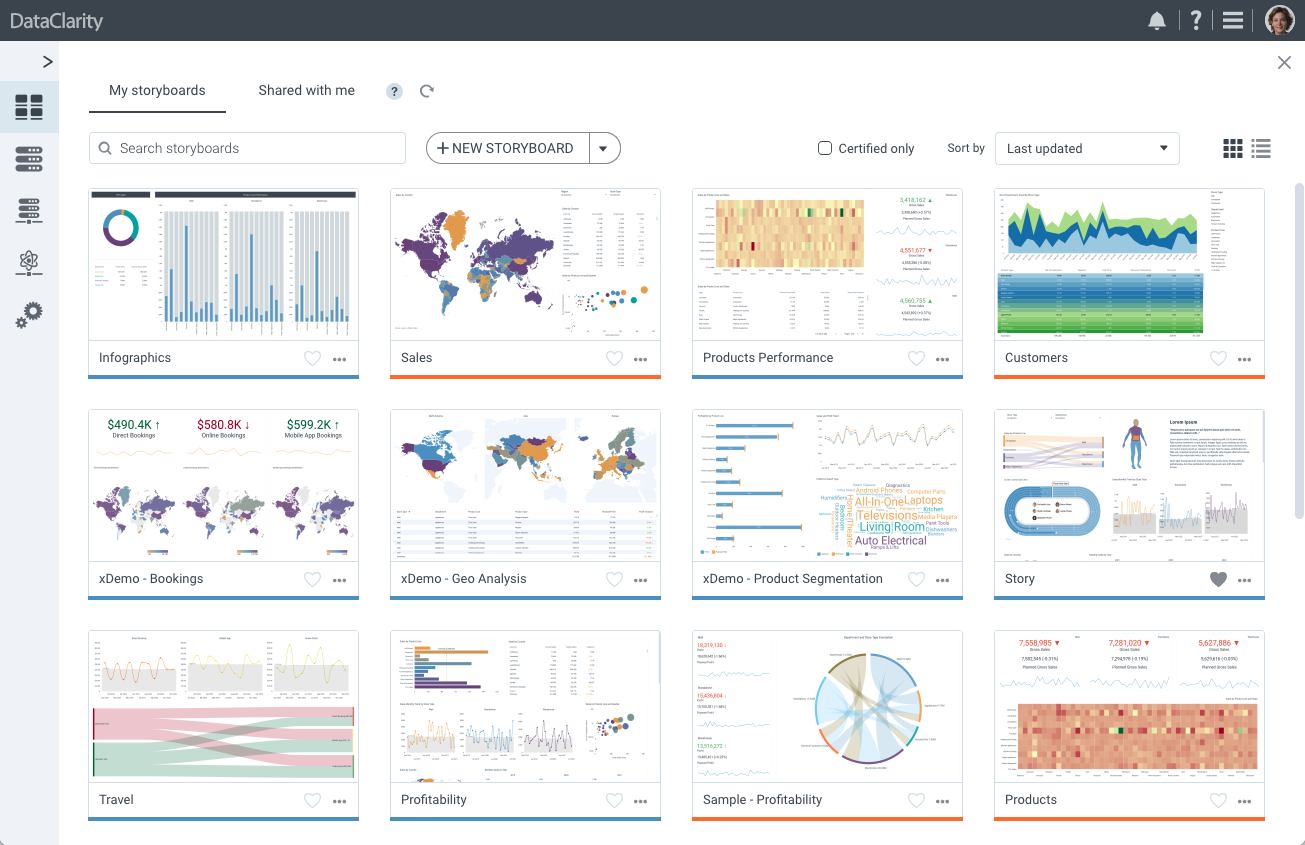
- Explore the seamless integration of Data Preparation and Storyboards in our enhanced, unified web application for a smoother and more efficient user experience.
- Enhance your data stories with advanced visualization capabilities: from custom JavaScript charts for in-depth analytics to a broader selection of geospatial maps for engaging storytelling.
Get DataClarity or upgrade to DataClarity 2023.6 today to take advantage of all these great innovations. Now, let’s take a closer look at some of the greatest features in this release.
Enhanced Dataset Metadata Validation for Data Integrity
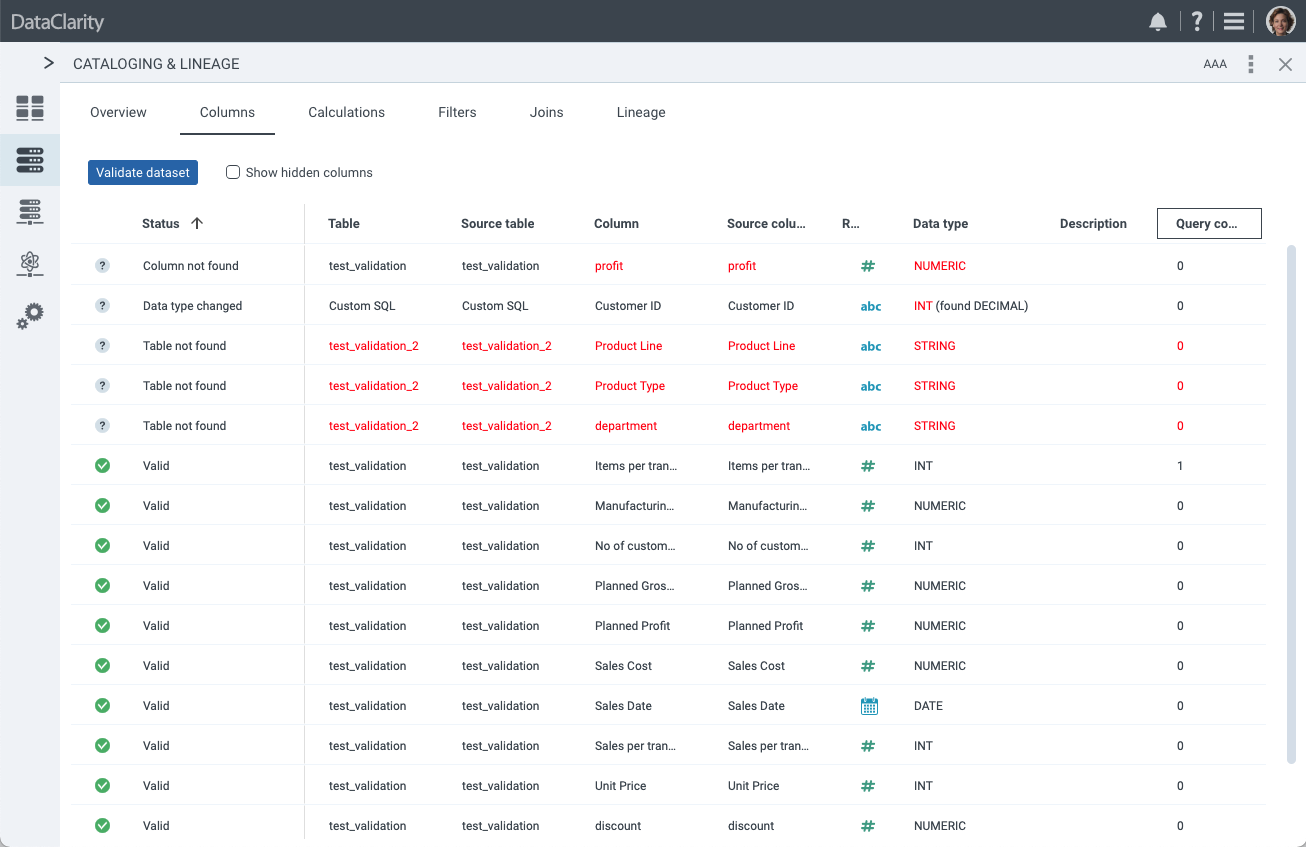
In this release, we have introduced a new feature for dataset stewards, allowing them to validate the metadata of datasets to ensure data integrity and prevent potential storyboard visualization errors. With this enhancement, stewards can perform three types of validations:
- Table existence: check if tables used in the dataset still exist in the database.
- Column existence: verify the existence of columns used in the dataset within the database.
- Data type consistency: ensure that the data types of columns in the dataset match those in the database, preventing synchronization issues.
This feature is accessible within the “Dataset Cataloging and Lineage” section under the “Columns” tab, where stewards can click “Validate metadata”. After performing the validation, the grid displaying the list of columns is updated to show the validation results. If any validation issues are detected, users can easily identify the type of issue and take necessary actions to maintain data quality and the proper functioning of storyboards.
Top User Query Counts in Dataset Usage Stats Notifications
We’re continuing to enhance the information of the Datasets Cataloging and Lineage feature, making it easier for users to understand dataset usage and contributions. Previously, the feature displayed the top 5 users who utilized a specific dataset but did not provide detailed metrics regarding their activity. The new release includes the following:
- Number of queries: For each of the top users who have used a dataset, we now display the number of queries they have performed against that dataset. This additional metric provides valuable insights into the level of engagement and activity of each user.
- Graphical bar chart: To make it even easier to understand user contributions, we have introduced a graphical bar chart that visualizes the usage statistics of the top users. This chart allows users to quickly assess how much each top user has interacted with the dataset, improving the overall visibility of dataset usage patterns.
- Profile pictures: We have added profile pictures or avatars alongside the display names (first and last names) of the top users. This visual enhancement not only personalizes the dataset lineage and cataloging screen but also provides users with a quick and recognizable visual indicator of each top user.
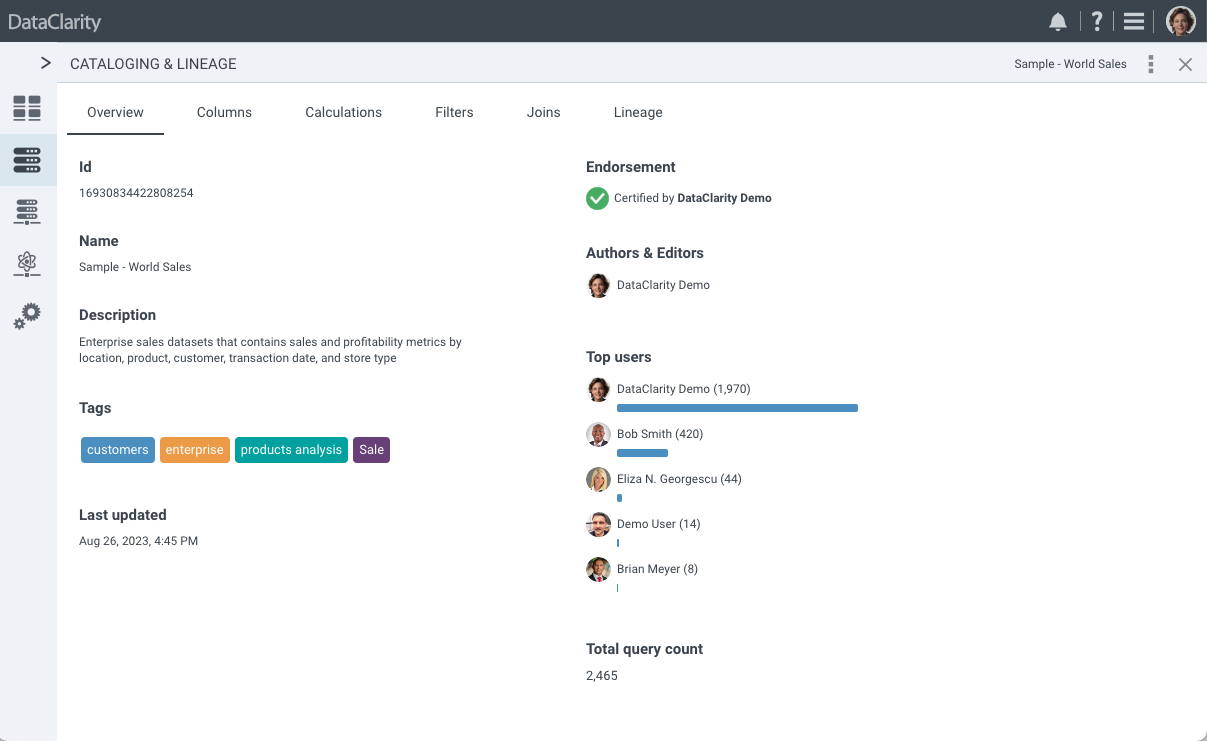
These enhancements make it more convenient for users to gain insights into dataset usage, understand user contributions, and navigate the Datasets Cataloging and Lineage feature. This improved clarity and visual representation contribute to a more user-friendly and informative experience when working with datasets.
Unified Web Application for Data Preparation and Storyboards
In this release, we have unified the Data Preparation and Storyboards applications into a single, cohesive web application, with a focus on improving performance and user experience. In the previous setup, Storyboards users had access to Data Preparation features through integration, which, while functional, presented opportunities for improvement.
With this enhancement, Storyboards users now have a single, faster, and more efficient web application that seamlessly combines both Storyboards and Data Preparation functionality. This integration not only improves the overall performance but also provides a more streamlined experience for users who work with both datasets and storyboards within the same application.
Key Highlights:
- Enhanced user experience: users, especially Storyboards users, will benefit from a more seamless and user-friendly experience when accessing both dataset and storyboard features within a single, unified application.
- Performance optimization: the integration of Storyboards and Data Preparation significantly improves overall performance, ensuring that users can work more efficiently and effectively.
- Streamlined access: users will no longer need to navigate between separate applications, simplifying their workflow and increasing productivity.
- Simplified maintenance: the consolidation of these services simplifies support, maintenance, and troubleshooting tasks, making it easier to manage the unified application.
This release represents a significant step forward, enhancing the performance and usability of the application, while also providing users with a more efficient and cohesive environment for working with datasets and storyboards.
Enhanced API Support for SQL Select Queries on Datasets
We have expanded the capabilities of the Storyboards and Datasets API, empowering developers to execute SQL select queries directly on datasets. Prior to this enhancement, developers, especially those working on embedded analytics and OEM use cases, could query dataset data using the API by providing input such as a list of columns, filters, and other parameters.
With this release, developers gain a powerful tool – they can now send SQL statements directly to query data using the datasets. Regardless of whether they are using Java, Python, or other programming languages, they can leverage the API to send SQL statements.
For example, developers can issue a query like: SELECT product, SUM(sales), SUM(profit) FROM dataset_sales WHERE region=’North America’.
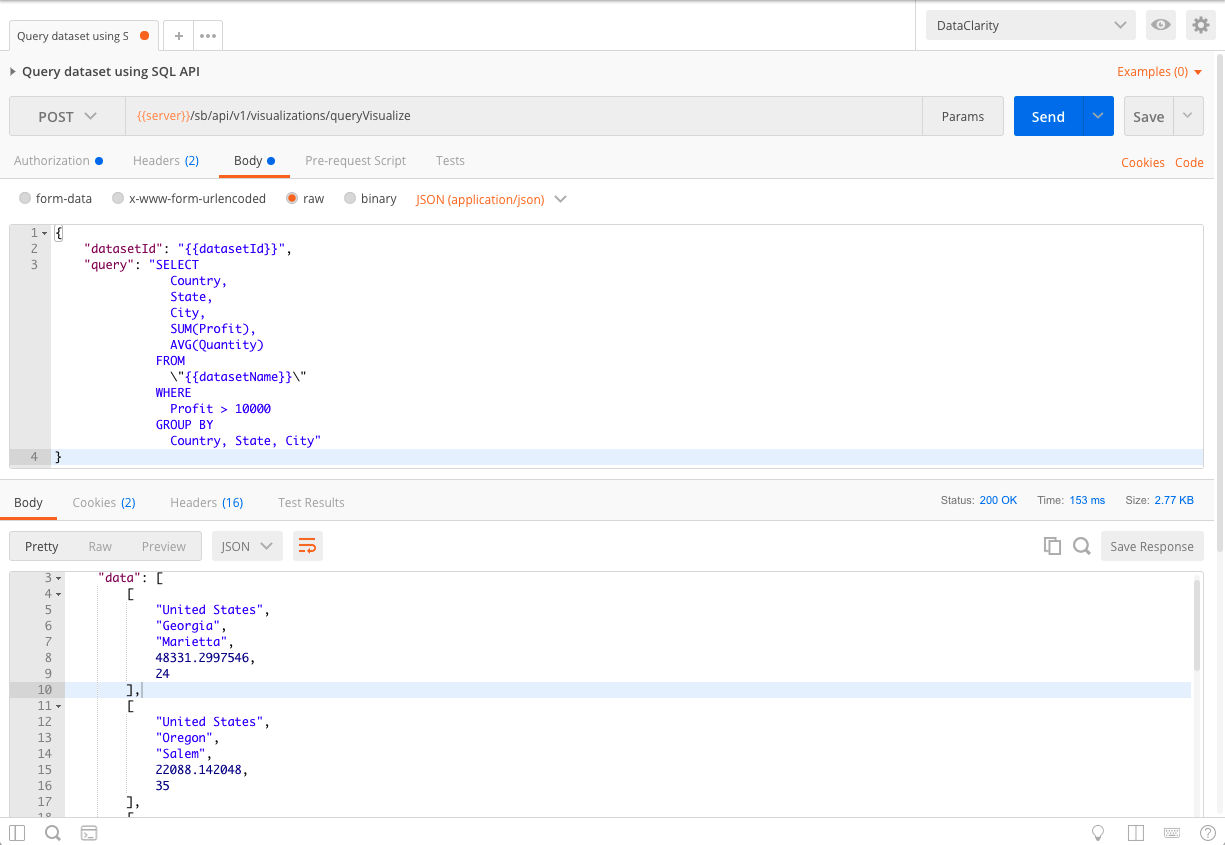
This feature introduces a standard SQL interface for querying data within datasets, offering greater flexibility and compatibility with various programming languages. Developers can harness the full potential of their preferred language to extract and manipulate data from datasets, streamlining their workflow and enabling more advanced data analysis and reporting capabilities.
Support for Viewing Data in Custom JavaScript Charts
We’re excited to introduce an enhancement that empowers you to explore and gain insights from custom JavaScript charts like never before. Now, for both standard and custom visualizations, you can easily view the data that feeds the custom chart, enhancing your data exploration capabilities.
In the chart “More Options” menu, you’ll find the “View Data” option. This feature was previously available for standard charts and has now been extended to custom visualizations created using JavaScript. Clicking “View Data” allows you to access and explore the underlying data that powers the chart.
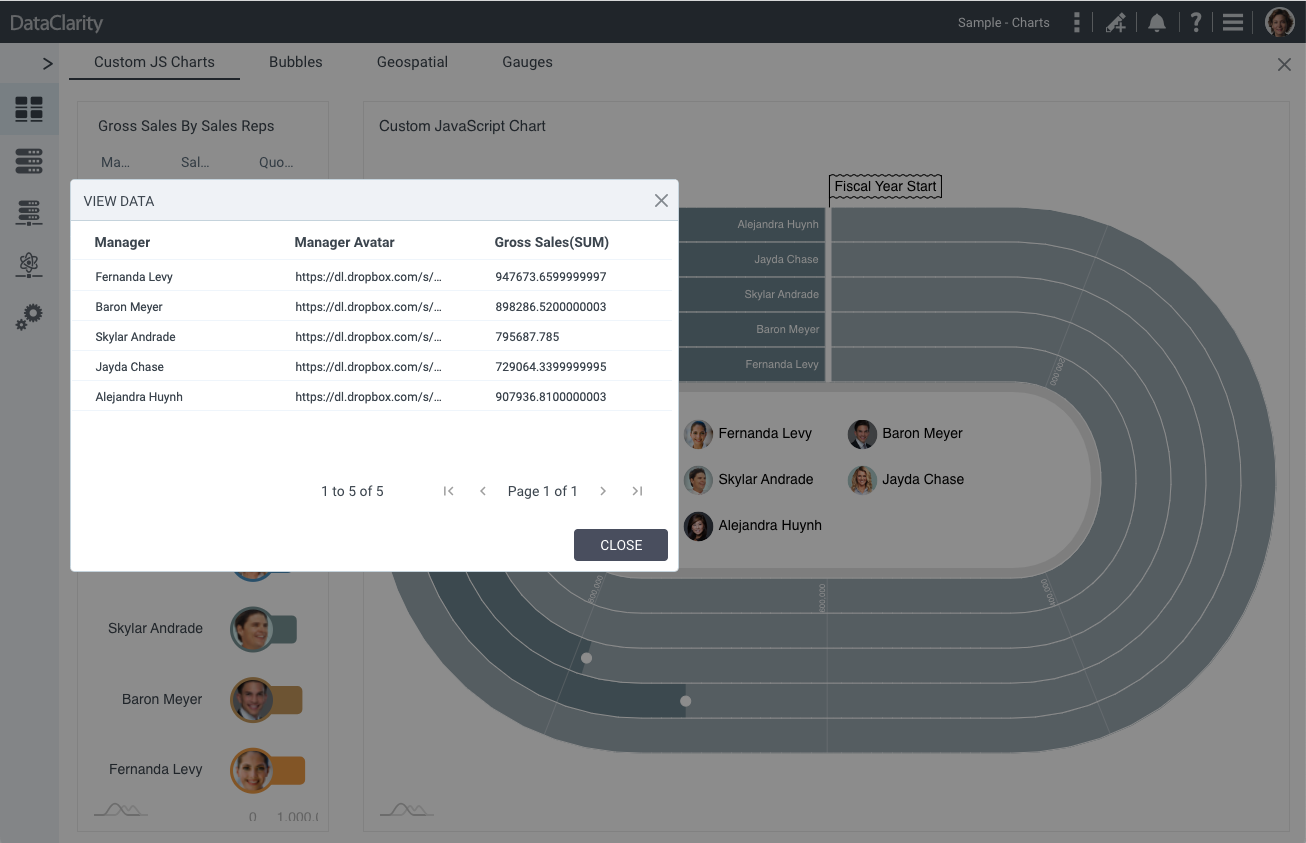
This enhancement provides a unified and consistent experience, giving you the ability to dive into the data behind both standard and custom charts. Whether you’re working with predefined charts or crafting custom visualizations, the “View Data” option ensures you have the insights you need at your fingertips.
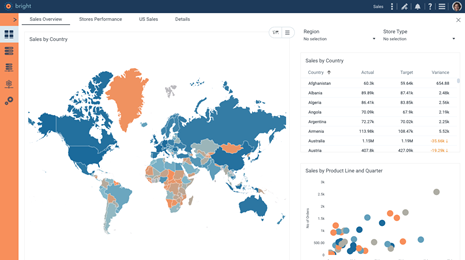
Expanded Geospatial Mapping Options
In this release, we have expanded the list of available geospatial maps in the Storyboards application, providing authors with more granular control over the representation of their data. Previously, the application supported a limited set of maps, including the United States map, World map, and individual maps for specific countries.
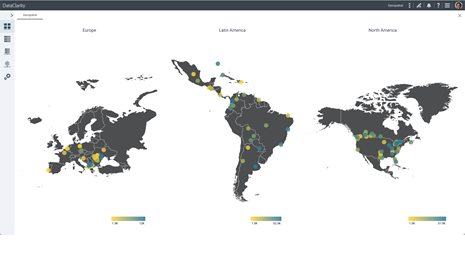
With this release, we have introduced an extensive selection of new maps, including maps for different regions and continents. The new map options include:
- Africa
- Asia
- Caribbean
- Central America
- Europe
- Middle East
- Oceania
- World Regions
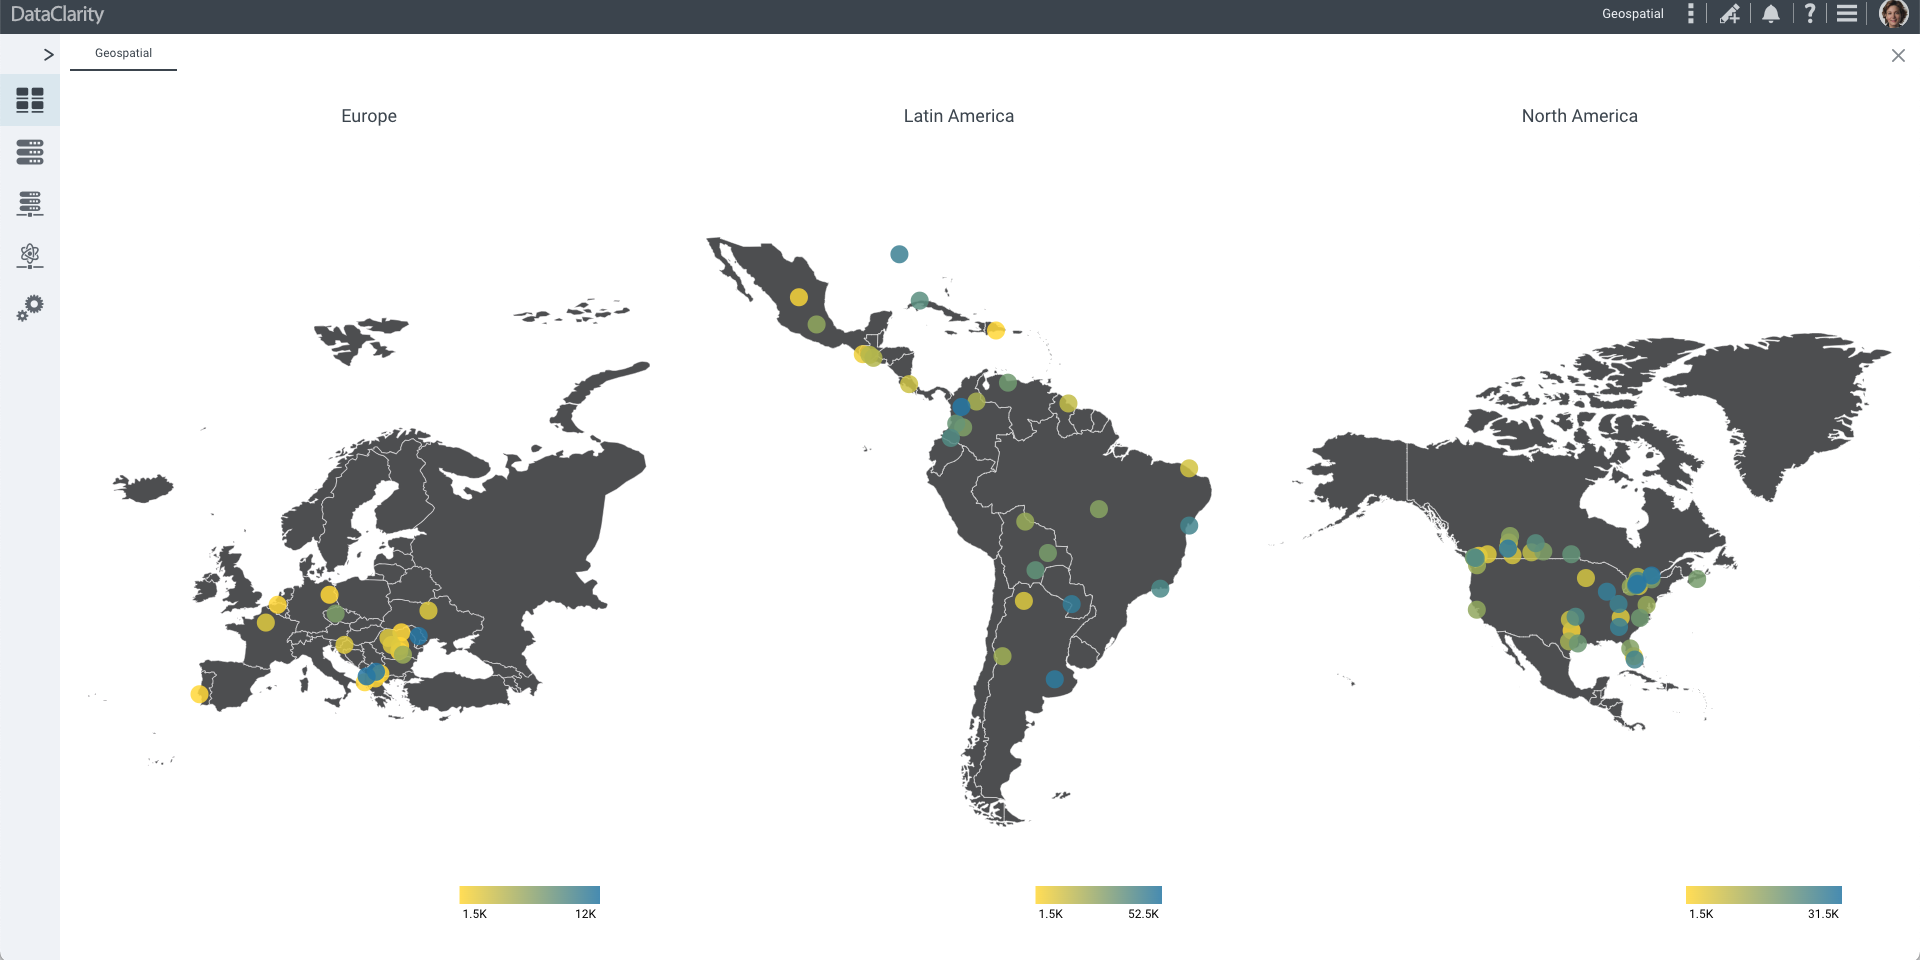
Authors can now refine their geospatial charts by selecting the specific map that corresponds to the geographical area they want to visualize. For example, if an author wants to display a geospatial chart for European countries, they can now choose the “Europe” map, and a map with only European countries will be displayed. This enhancement allows for more accurate and detailed data representation, making it easier for users to create meaningful geospatial visualizations tailored to their specific needs.
This expanded set of geospatial mapping options empowers authors to create more precise and relevant visualizations, enhancing the overall usability and effectiveness of the Storyboards application.
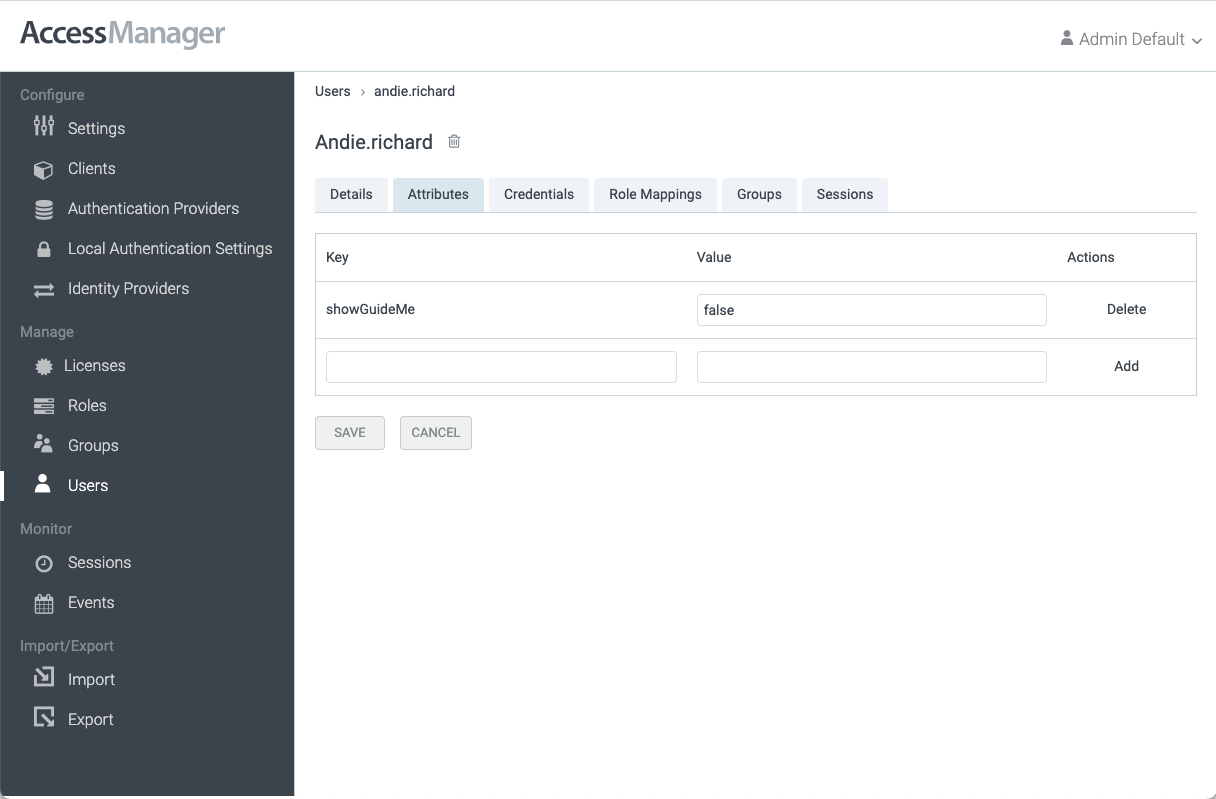
Introducing Admin-Controlled GuideMe Welcome Screen
In this release, we have added a new feature that allows administrators to control whether the GuideMe welcome screen is displayed to users when they access the Storyboards application for the first time.
Administrators can now use the User Access Manager to set an attribute for each user called “showGuideMe.” This attribute can have two values: “true” or “false.”
- If the “showGuideMe” attribute is set to “true” for a user, the GuideMe welcome screen will be displayed to that user when they access the application for the first time.
- If the “showGuideMe” attribute is set to “false” for a user, the GuideMe welcome screen will be disabled, and the user will not see it.
If the “showGuideMe” attribute is not set for a user, the GuideMe welcome screen will be displayed by default.
This new feature provides administrators with greater flexibility in managing the user experience for the Storyboards application, allowing them to tailor the onboarding process to their users’ needs and preferences.
Performance Optimization and UX Enhancements
We’re excited to introduce a series of improvements aimed at enhancing the overall user experience, addressing possible struggle points, and improving the efficiency of Storyboards and Data Preparation. These improvements include:
- Performance optimization: we have significantly optimized both the front-end and back-end of the Storyboards and Data Preparation, resulting in faster loading times and reduced resource consumption. This performance enhancement ensures a smoother user experience.
- Naming consistency: we have maintained naming consistency across all layers of data preparation, reducing confusion and ensuring that terminology remains uniform throughout the application.
- UI & UX enhancements: improvements to the user interface have made it more self-explanatory, transparent, and user-friendly. These improvements aim to eliminate uncertainty points for users, making the application easier to navigate and use effectively.
- Error handling: our error handling mechanisms have been improved to provide clearer and more informative error messages, helping users troubleshoot and resolve issues more effectively.
- Tooltips enhancement: tooltips were improved to provide users with additional context and guidance, making it easier for them to understand various features and functions.
- User actions streamlining: we have worked to improve user actions’ consistency and minimize repetitiveness, reducing the steps required to perform common tasks and improving the overall workflow.
- Success messages: we have improved success messages to provide users with clearer feedback when actions are completed successfully, ensuring that users have confidence in their actions’ outcomes.
These comprehensive enhancements aim to make the Storyboards and Data Preparation more efficient, user-friendly, and transparent. Users will experience improved performance, better guidance, and a more streamlined workflow, resulting in a more satisfying and productive user experience.
Want to learn more?
- Download the latest version today!
- Download Release Notes 2023.6 now!
- Explore all DataClarity releases.
- Get an overview of DataClarity Unlimited Analytics.
Latest Articles
-
 Branding & White Label
Beyond Colors: Brand & White Label Embedded Analytics

In the world of embedded analytics, branding isn’t just a detail – it’s a cornerstone. Effective branding ensures that analytics are not only insightful but also visually consistent with the company’s identity. -
Embedded Analytics
The Evolution of SaaS Applications: The Transition to Embedded DATA Analytics
Embedded Analytics has long been transformative in SaaS applications, enhancing the user experience and decision-making with integrated data insights. As the digital landscape evolves, a new frontier, Embedded DATA Analytics, emerges. -
Releases
Explore the New Exciting Features in DataClarity 2023.6

DataClarity 2023.6 brings a suite of transformative features designed to improve data accuracy, streamline analytics integration, and enable deeper data analysis for a wide range of users from data experts to business professionals.