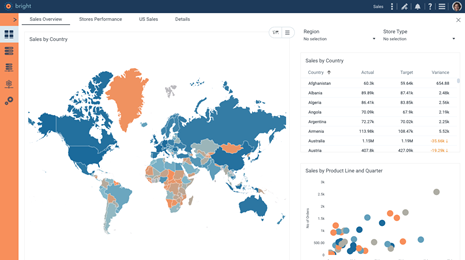
Inside DataClarity 2024.1: Expanded cloud database connectivity, improved data management, enhanced data visualization and exploration, and more

- Enhanced cloud database connectivity, including Amazon RDS for DB2, Azure Databases for MariaDB, MySQL, and PostgreSQL, and Google Cloud SQL for SQL Server.
- Expanded support for Google Cloud services with connection capabilities for Google Cloud Spanner for PostgreSQL.
- Improved data management and analytics features, allowing for deployment of Python models as endpoints for advanced computing.
- User interface enhancements with the ability to copy-paste storyboard pages for efficient content duplication and editing.
- Enhanced data visualization options with the ability to sort by columns in the “Others” field for more intuitive data exploration.
- Advanced date and datetime filtering capabilities for more precise data analysis and reporting, improving user control over data selection criteria.
Get DataClarity or upgrade to DataClarity 2024.1 today to take advantage of all these great enhacements. Now, let’s take a closer look at some of the greatest features in this release.
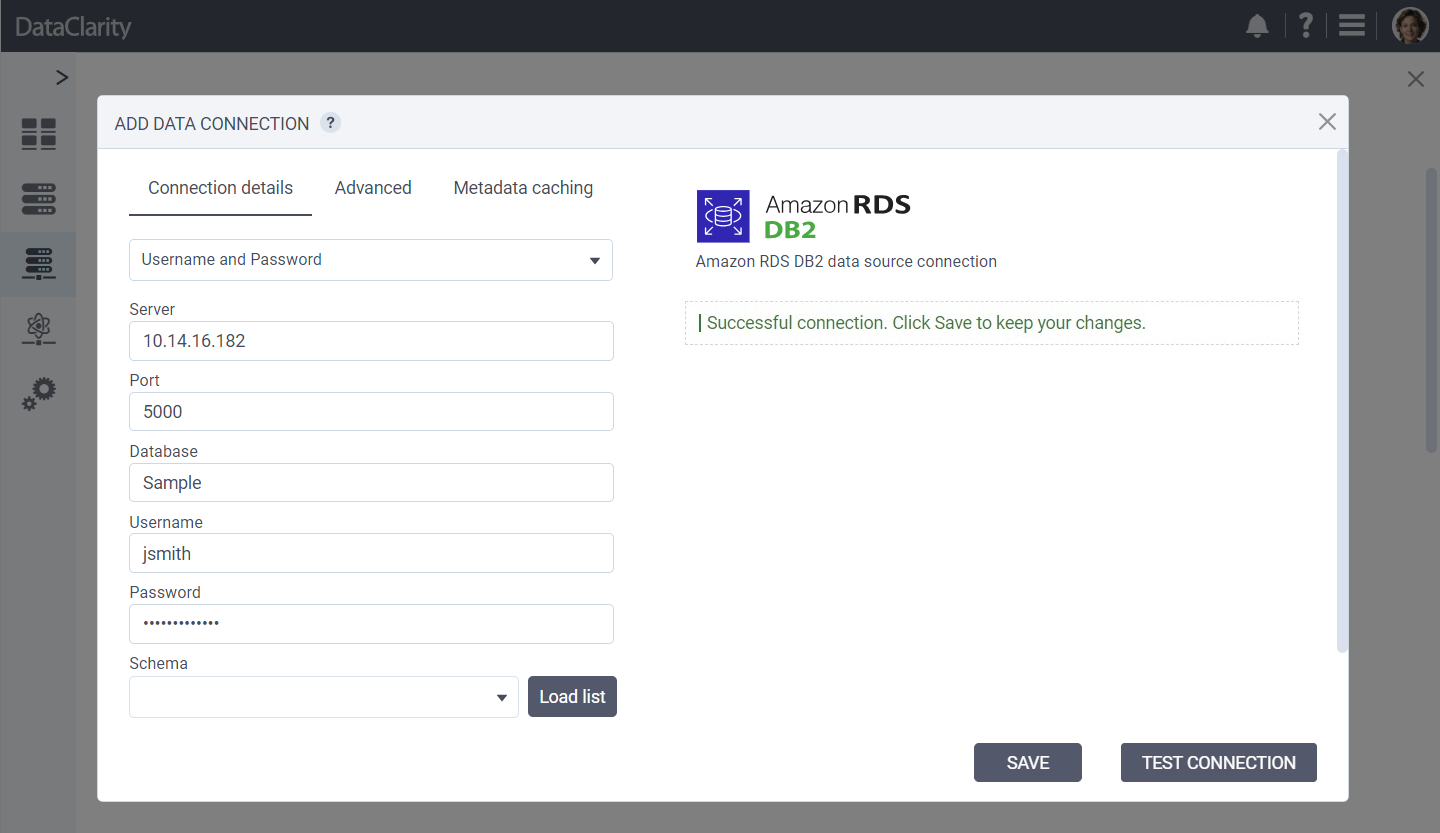
Support for Amazon RDS for DB2 Connection
The new release includes the expansion of our database connectivity options with the addition of support for Amazon RDS for DB2. This enhancement grants users access to a wider variety of data sources through Amazon RDS for DB2, facilitating improved data analysis and streamlined management.
Support for Azure Database for MariaDB Connection
This release broadens our platform’s database connectivity by adding support for Azure Database for MariaDB, providing users with access to a more diverse range of data sources. This addition not only enriches data analysis and insights but also optimizes data management efficiency through the robust, scalable, and secure environment offered by Azure Database for MariaDB.

Support for Azure Database for MySQL Connection
We are excited to announce the addition of Azure Database for MySQL to our suite of supported database connections. This enhancement signifies our ongoing dedication to improving data access and versatility for our users, empowering them to leverage the robust capabilities of cloud technologies for more sophisticated data insights and superior data management capabilities.

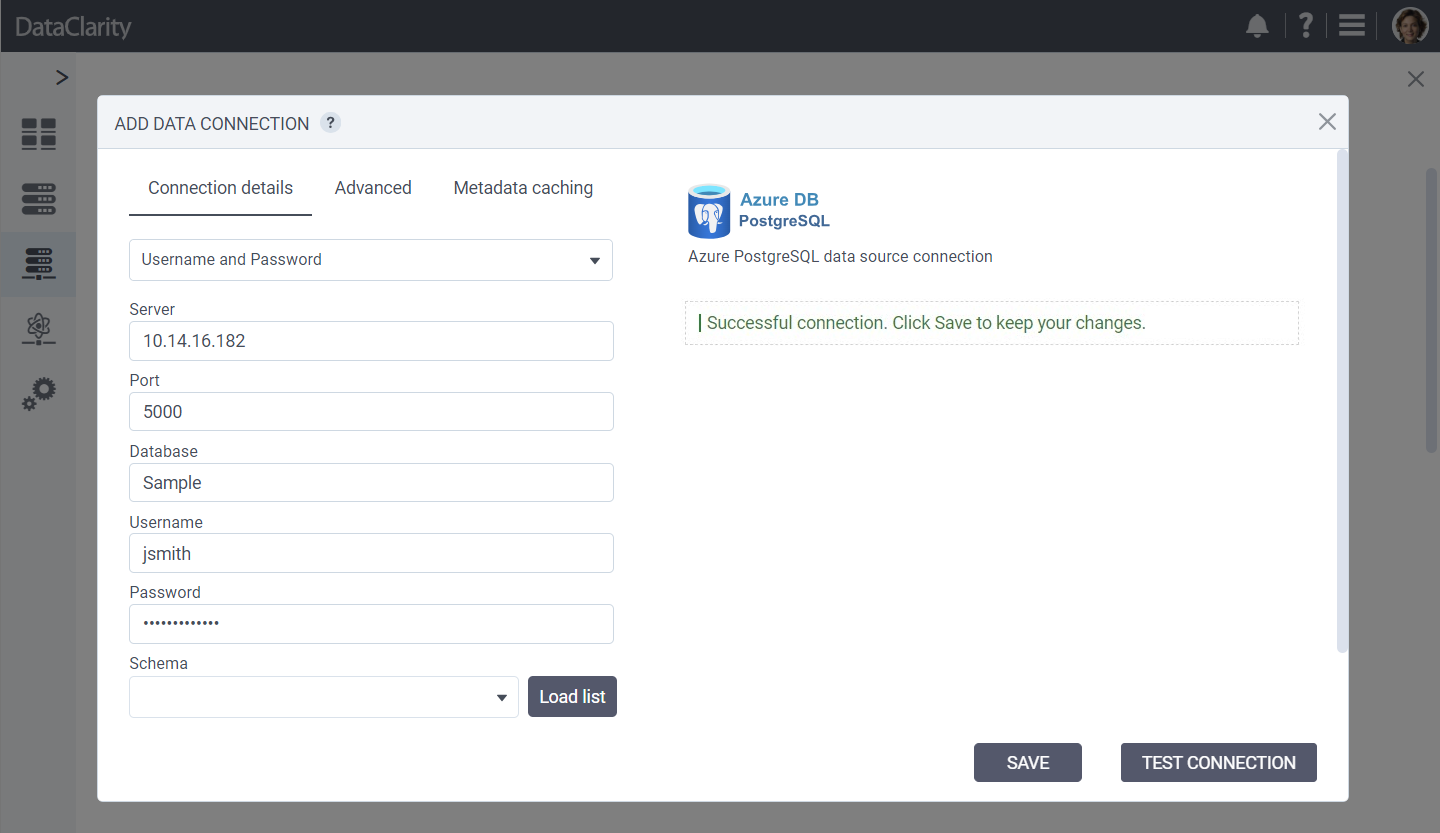
Support for Azure Database for PostgreSQL Connection
We’re pleased to unveil support for Azure Database for PostgreSQL, expanding our database connectivity range. This new feature enhances our platform’s ability to integrate with cloud databases, offering users more flexibility in managing and analyzing their data. It ensures seamless access to scalable, secure, and highly available PostgreSQL database services in the cloud.
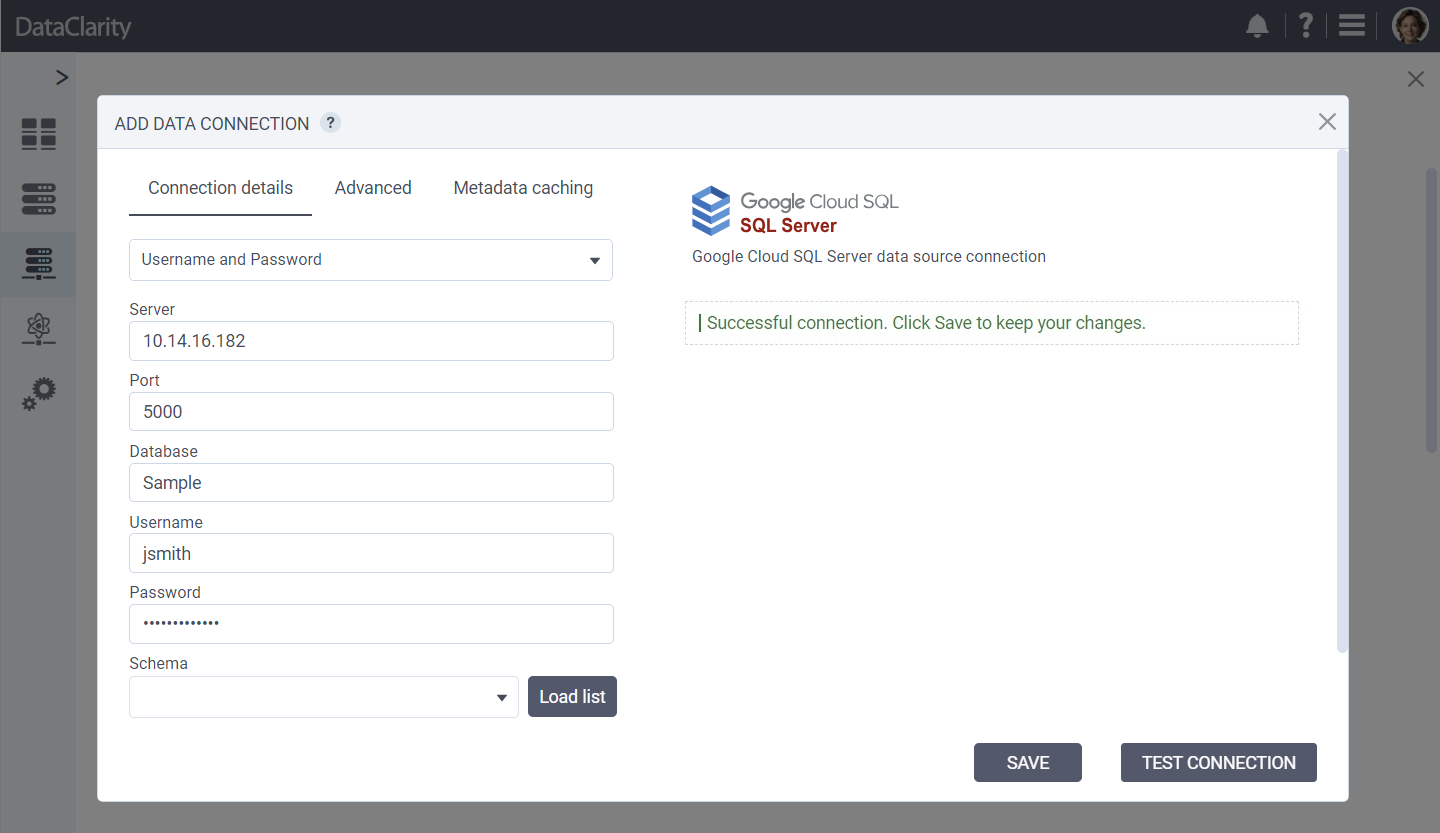
Support for Google Cloud SQL for SQL Server Connection
This release is also introducing support for Google Cloud SQL for SQL Server, expanding our database connectivity portfolio. This new feature offers users seamless access to Google Cloud’s highly reliable and scalable SQL Server instances, enriching our platform’s data management and analysis tools. By integrating with Google Cloud SQL, users gain the advantage of enhanced analytical efficiency in a secure cloud environment.
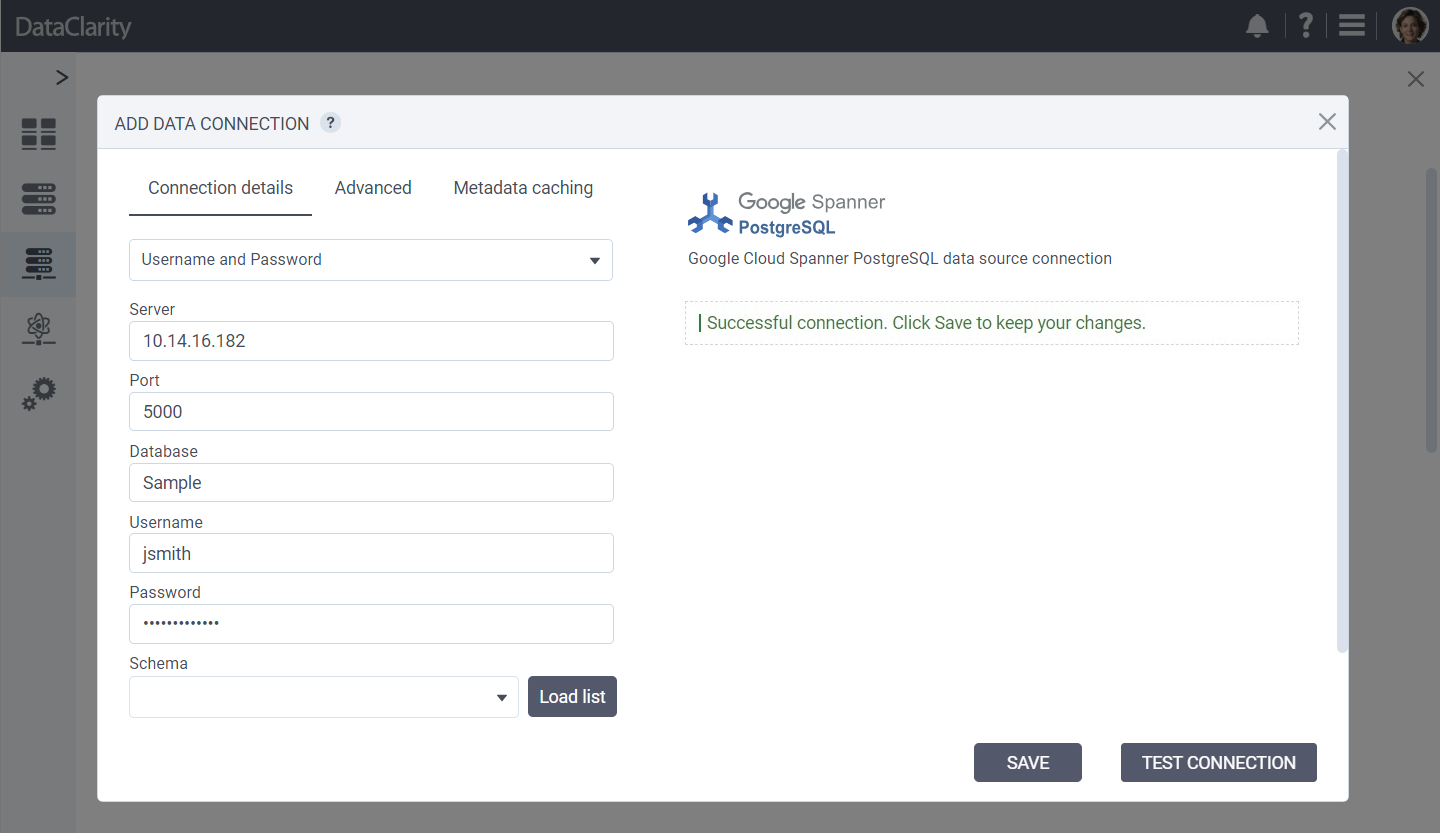
Support for Google Cloud Spanner for PostgreSQL Connection
We also added support for Google Cloud Spanner for PostgreSQL connections, marking a significant enhancement to our database connectivity capabilities. This integration allows users to leverage Google Cloud Spanner’s global scalability and strong consistency with PostgreSQL’s versatility. By connecting to Google Cloud Spanner for PostgreSQL, users can now enjoy more robust data management, streamlined operations, and advanced analytical opportunities within our platform.
Deploy Python Models as Endpoints
In this release, we are introducing a powerful feature that allows data scientists to deploy Python models as endpoints within the application. This enhancement facilitates the seamless integration of Python models, enhancing flexibility and usability.
Key Features and Benefits:
- Model deployment – data scientists can now upload Python files to a persistent location, making them accessible for deployment as endpoints. Each time the Python Server pod runs, the Python engine will load and deploy these Python models as endpoints.
- Execution options – once deployed, data scientists can utilize these endpoints both within Storyboards and via API to execute Python models. This provides a versatile way to leverage Python-based machine learning and analytics within the application.
This enhancement empowers data scientists to harness the capabilities of Python models within the application, enabling them to seamlessly integrate their machine-learning solutions into the data visualization and analytics workflow. With the ability to deploy and execute Python models as endpoints, users can access advanced analytical tools and gain deeper insights, enhancing the overall value of the application.
Storyboard Page Copy-Paste
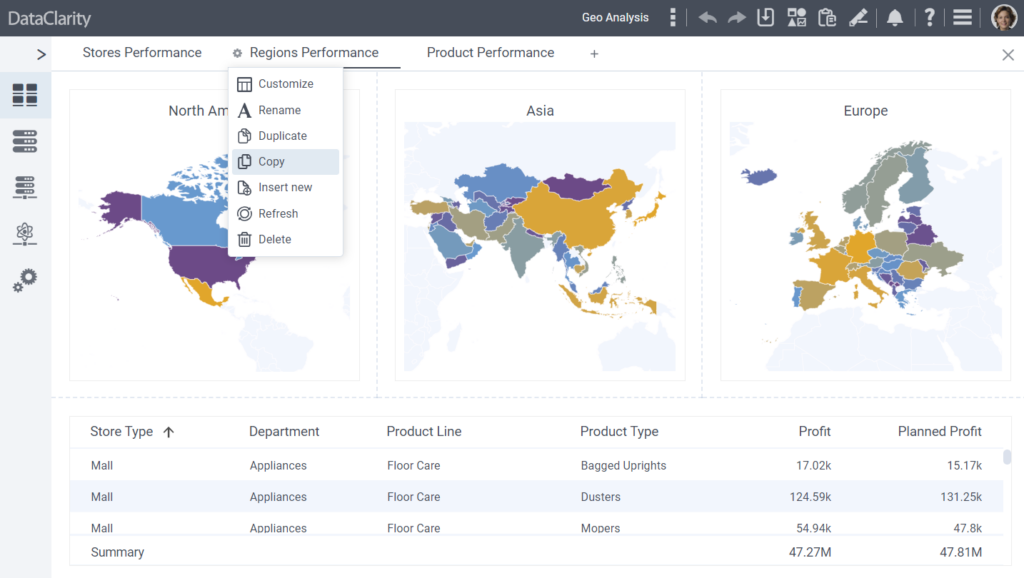
In this release, we have introduced a valuable feature that empowers Storyboard authors to copy and paste entire storyboard pages. Prior to this enhancement, the application supported copy-and-paste functionality for individual widgets, but now we have extended this capability to include entire pages.
When you copy a storyboard page, the JSON metadata representing that page is saved to your clipboard. You have the flexibility to paste it within the same browser session or copy it into a text document for later use. This addition simplifies the process of duplicating and reusing entire sections of a storyboard, making it more efficient for authors to create engaging and consistent visualizations.
Sort by Columns in “Others” Field
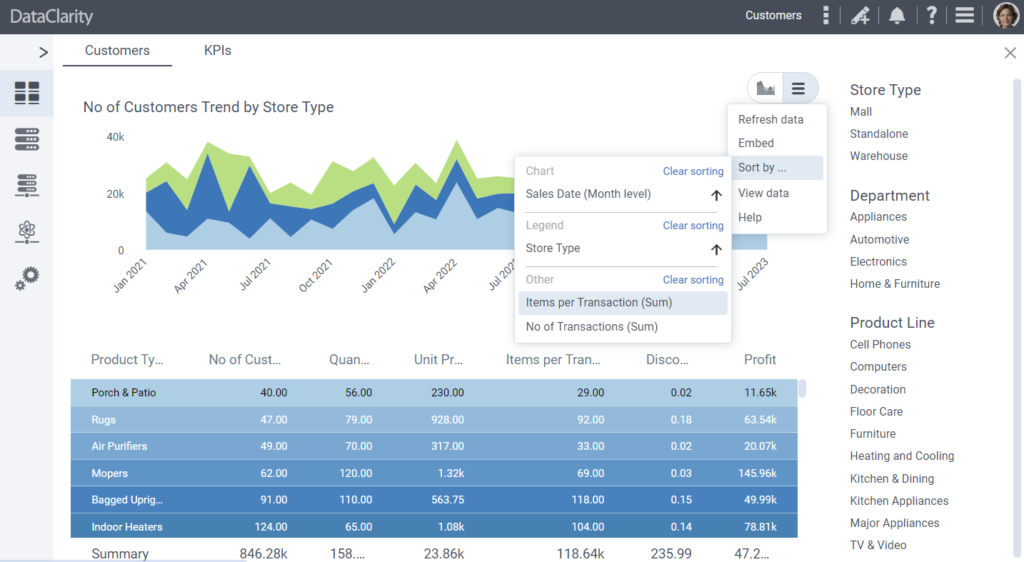
Starting this release, we have introduced an enhancement to our visualization settings, specifically in the “Others” field. Authors can add columns to the “Others” field, which includes them in the query but does not use them as measures in the chart. Additionally, when rendering the chart, we provide end users with options to sort the chart data based on columns listed in dimensions, measures, colors, or trellis fields.
This feature brings greater flexibility and control over how they interact with and analyze the visualized data.
Advanced Date and Datetime Filtering
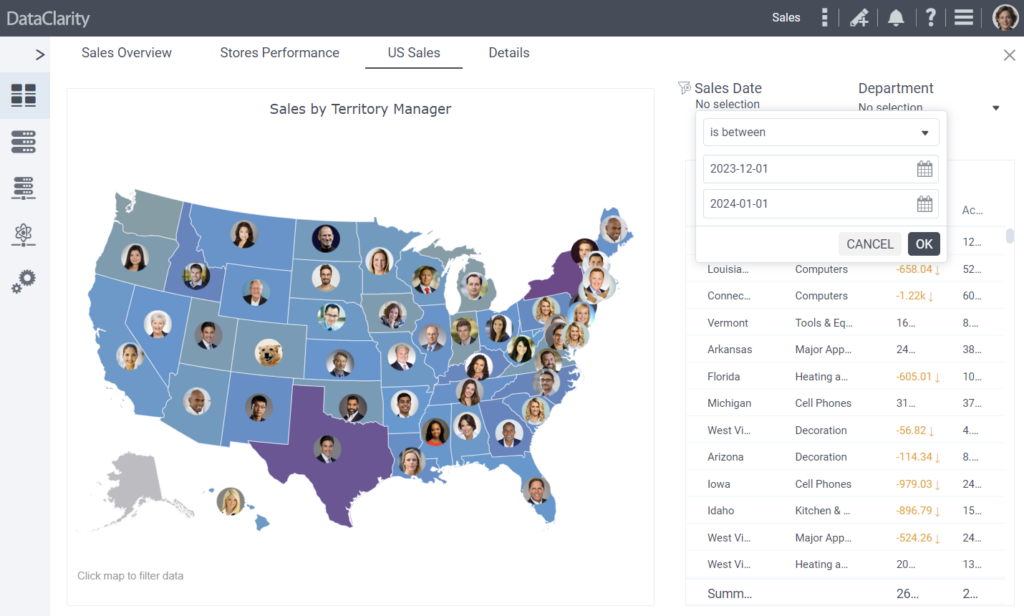
This release brings significantly enhanced date and datetime filtering options for end users when working with datetime type columns in filters. Previously, when authors set the “Default” format for filter prompt values, end users were presented with a list of dates to select from. With this enhancement, we are introducing a range of powerful filtering capabilities for a more intuitive and flexible user experience.
Key enhancements:
- Filter Operators – end users now have access to a variety of filter operators, including “equals,” “does not equal,” “is greater than,” “is greater than or equal to,” “is less than,” “is less than or equal to,” and “is between.” These operators allow users to precisely define their filtering criteria.
- Date and Datetime Picker – instead of selecting dates from a dropdown or list, users can now utilize a date or datetime picker when choosing values based on the selected filter operator. This picker simplifies the process of selecting dates and times, making it more user-friendly and efficient.
- Consistency with Authoring – this enhancement aligns the end-user experience with filter selection to be consistent with authors when defining chart data filters. Authors have already been using a similar user interface during the authoring process, ensuring a seamless transition for end users.
These improvements significantly enhance the user experience for date and datetime filtering, providing end users with more control and flexibility when refining data selections. The introduction of filter operators and improved pickers simplifies the process, making it easier to precisely define and apply date filters in line with their specific needs.
Want to learn more?
- Download the latest version today!
- Download Release Notes 2024.1 now!
- Explore all DataClarity releases.
- Get an overview of DataClarity Unlimited Analytics.
Latest Articles
-
 GenAI/ML
Advanced Data Capabilities Power GenAI/LLM & Embedded Analytics

See how enterprise-grade embedded analytics and data solutions are reshaping the global SaaS scene with enhanced capabilities, real-time insights, and cutting-edge, AI-driven self-service. -
Branding & White Label
Beyond Colors: Brand & White Label Embedded Analytics
In the world of embedded analytics, branding isn’t just a detail – it’s a cornerstone. Effective branding ensures that analytics are not only insightful but also visually consistent with the company’s identity. -
Embedded Analytics
The Evolution of SaaS Applications: The Transition to Embedded DATA Analytics
Embedded Analytics has long been transformative in SaaS applications, enhancing the user experience and decision-making with integrated data insights. As the digital landscape evolves, a new frontier, Embedded DATA Analytics, emerges.