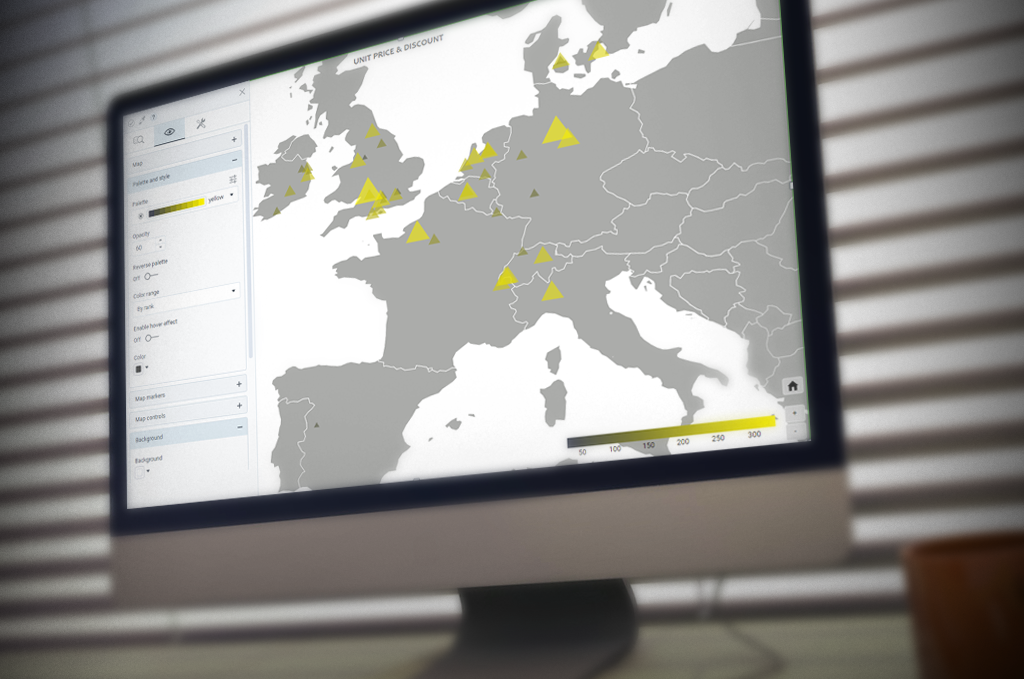
Get the most out of Pointer Maps

Your data is geographically distributed, and you want to visualize at least two metrics in your data? The pointer map might be a good choice. The pointer map, also

The Power of Logarithmic Scale

The Power of Logarithmic Scale What’s a logarithmic scale? That’s a commonly asked question by storyboard designers. Let’s uncover its true power by seeing when and how the logarithmic

DataClarity 2021.1 is here

DataClarity 2021.1 is here Check out the latest features included in this release! Now available in DataClarity

2020-9-features

DataClarity 2020.9 is here Check out the latest features included in this release! Now available in DataClarity

Go to Top