The Power of Logarithmic Scale

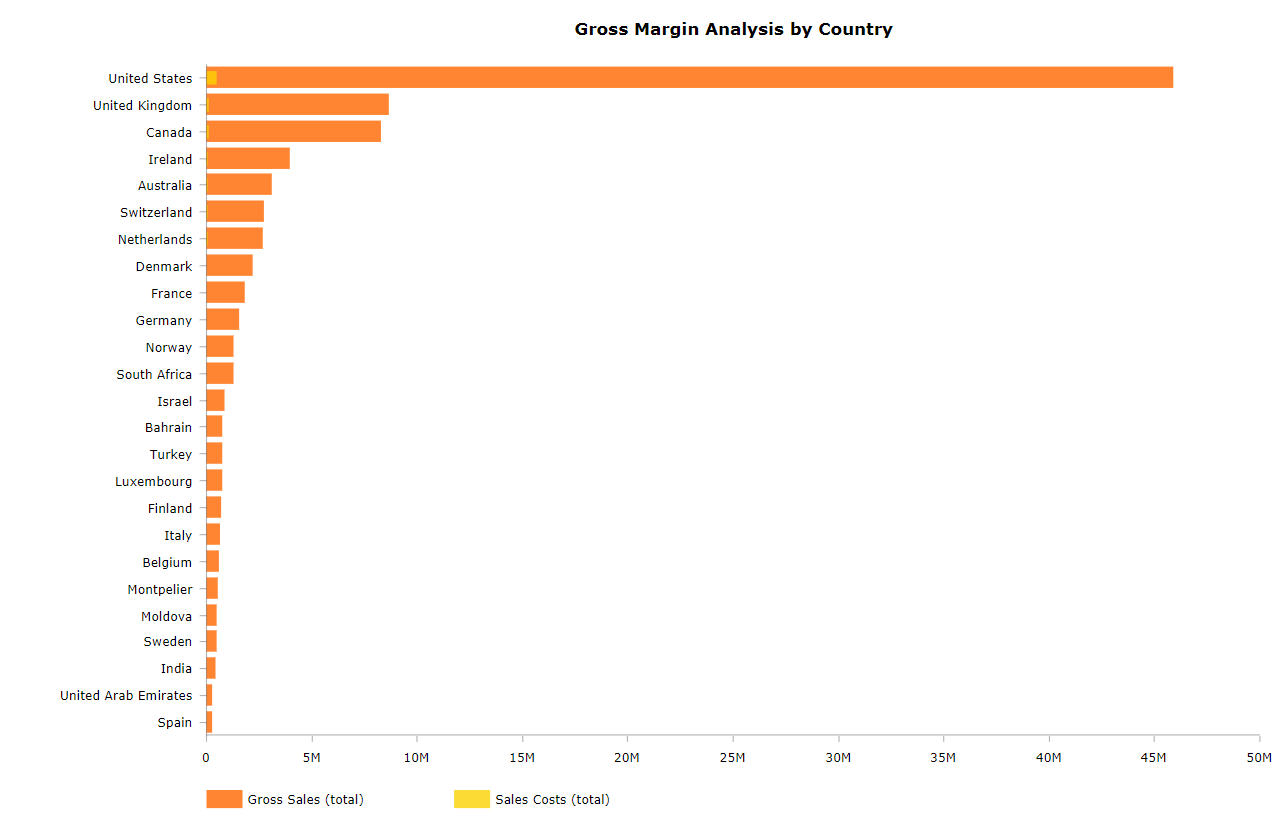
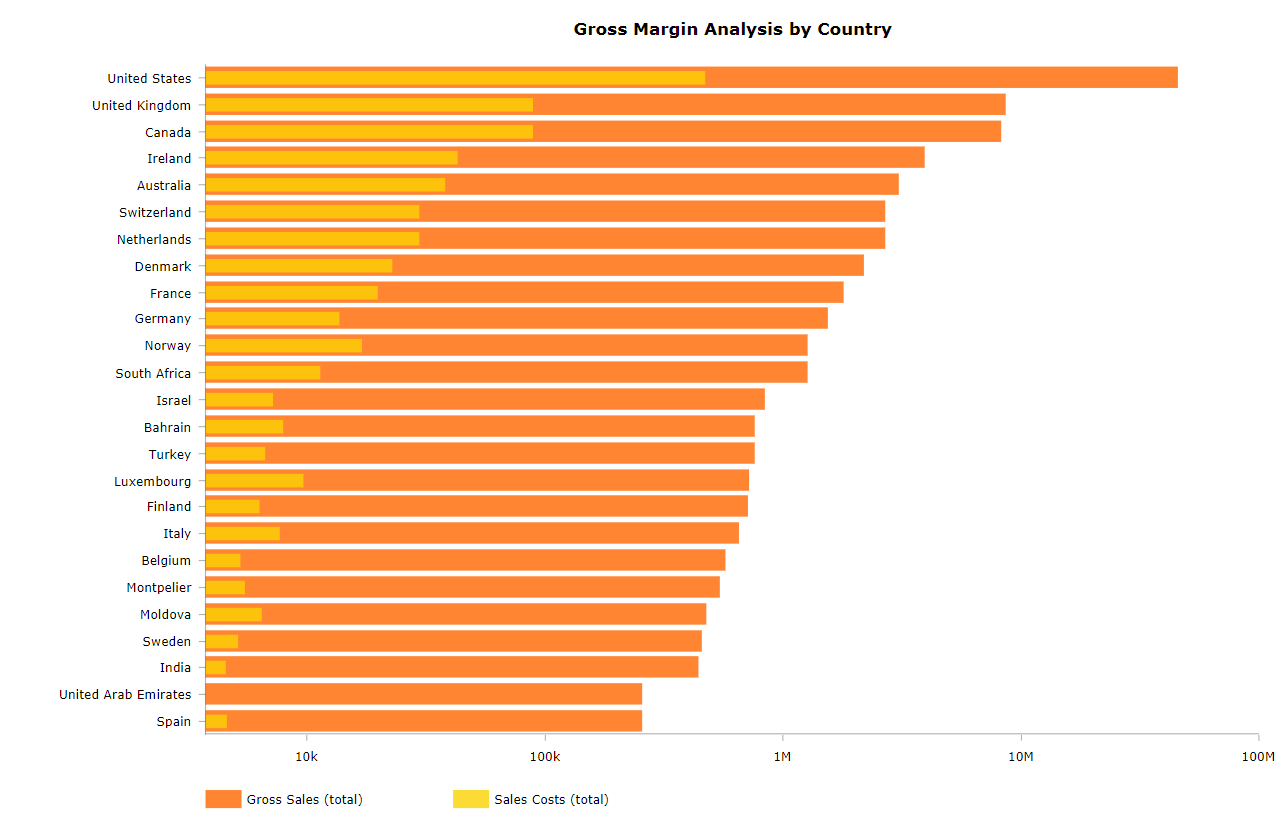
Now, let’s select the logarithmic scale option for the chart and observe how the visualization changes. You can see, for example, that the United Arab Emirates (UAE) and Spain both have about the same gross sales but Spain’s sales costs are significantly higher than those in the UAE.
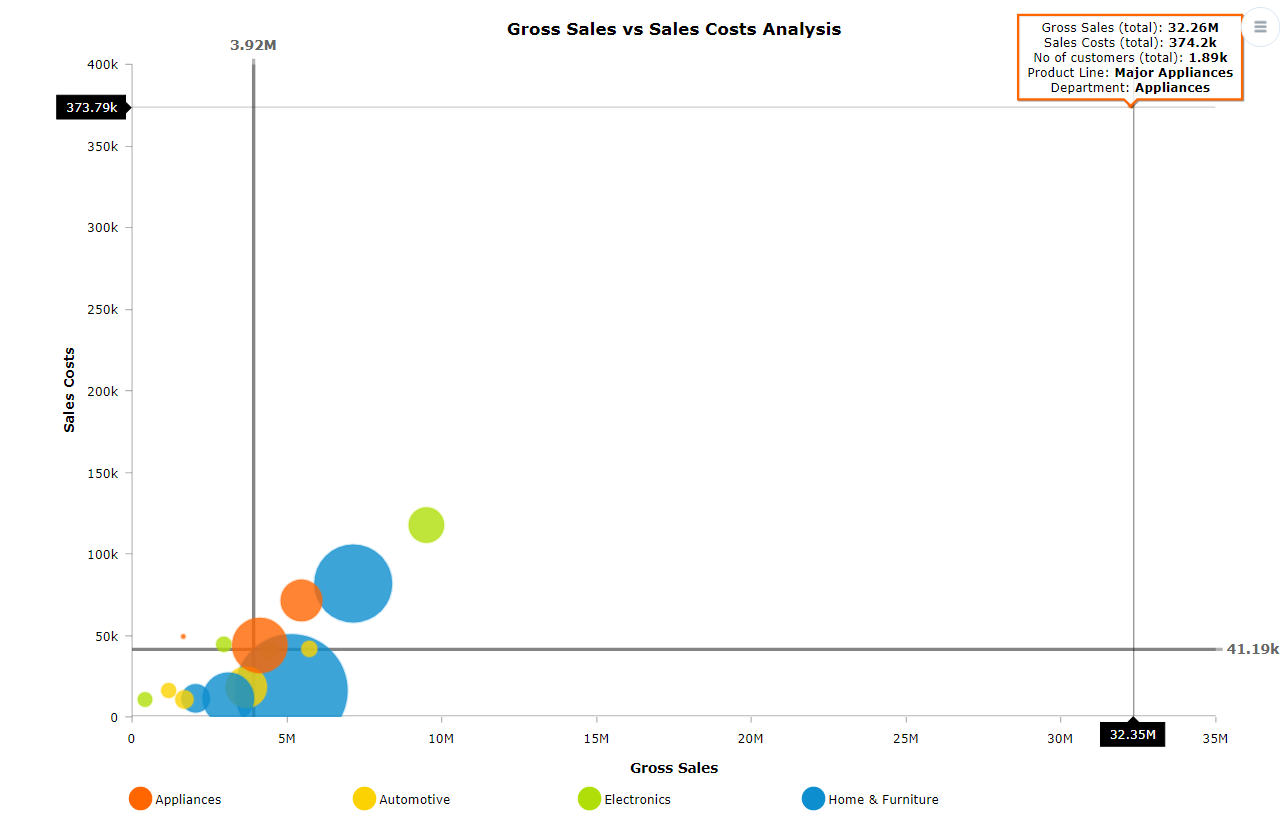
With this example in mind, let me try to explain what is a logarithmic scale. A logarithmic scale is a nonlinear scale that’s used when there is a large value range in your dataset. Instead of a standard linear scale, the values are based on order of magnitude. Each mark on an axis represents a value that is a multiple of the previous mark on the axis. For example, when using a base 10 log scale, the first mark shows 10 which is 101, the second mark is 100 which is 102, the third mark is 1,000 which is 103, and so on. Not all logarithmic scales use base 10. Depending on the dataset, using the DataClarity visualizations, we can determine the best logarithmic scale to use for plotting the data.Let’s look at two other examples to see how the logarithmic scale can improve the ability to spot patterns and identify relationships in your data.By using a bubble chart, we have plotted the sales costs vs. gross sales for each product line. The size of each bubble is the number of customers, and each department is segmented by a color. We have one extreme outlier which is causing the bulk of the data to be clustered together in the lower-left section of the chart.
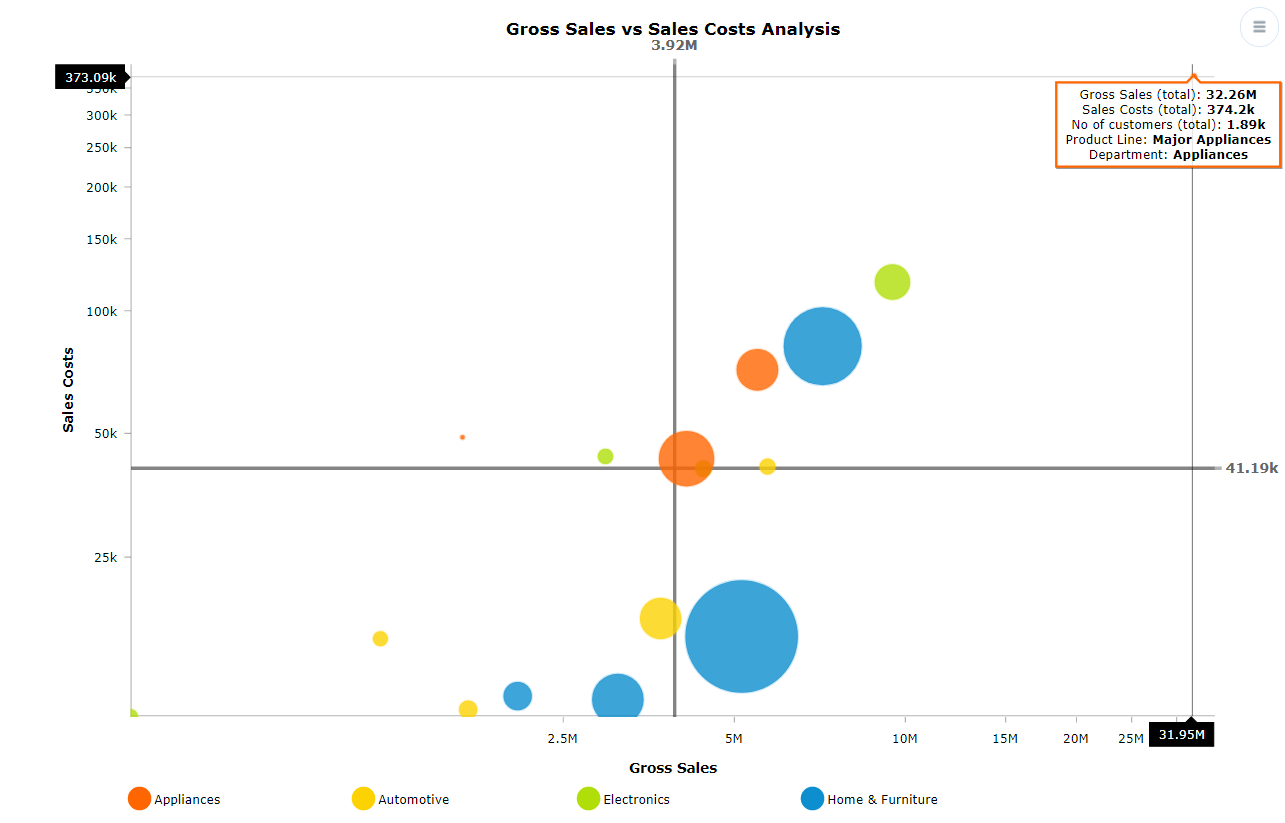
With the logarithmic scale applied, we decided to use a non-base 10 log scale. You can now see that there are quite a few product lines that have high gross sales and very low sales costs.
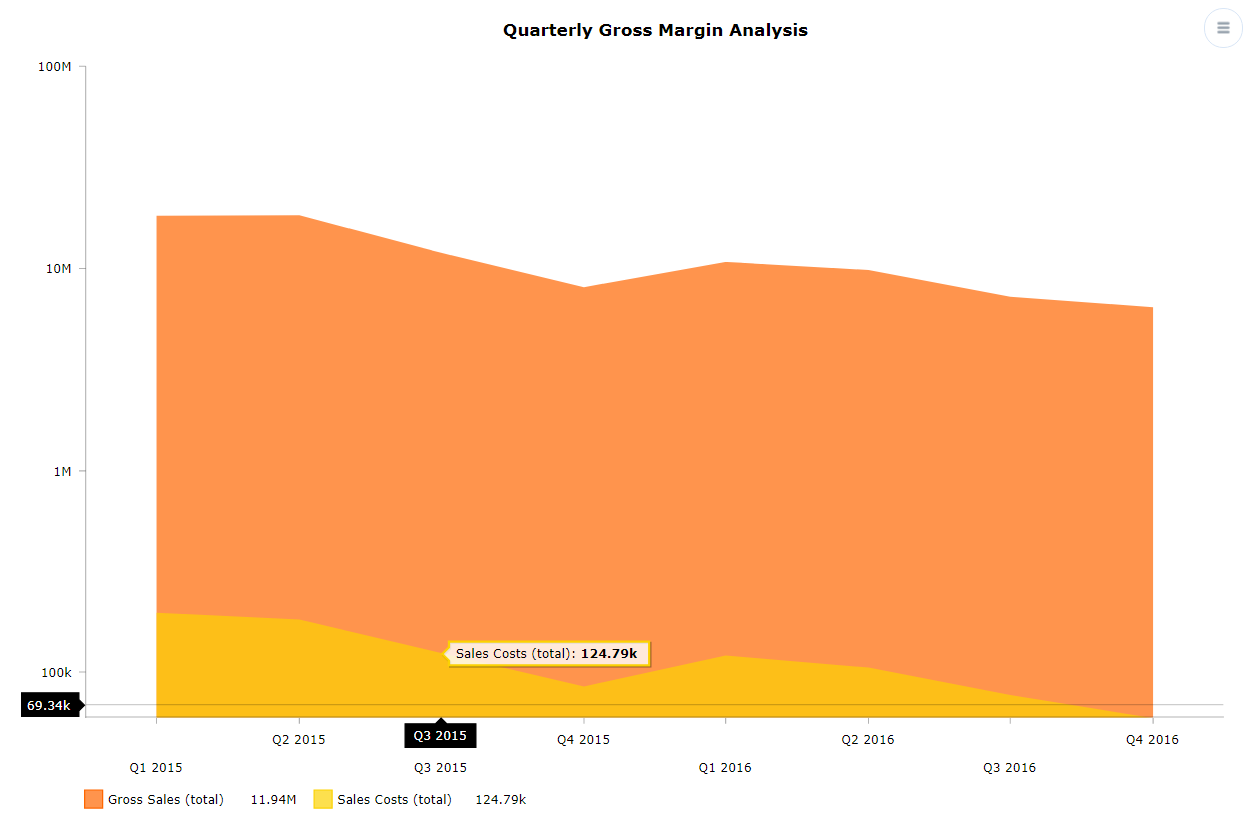
Another example is analyzing the gross sales and sales costs data by quarter using an area chart. We can see that the gross sales area (colored in orange) is easy to read using a standard linear scale for the Y-axis, but the sales costs area (colored in yellow) is hard to examine due to the variances in the data.
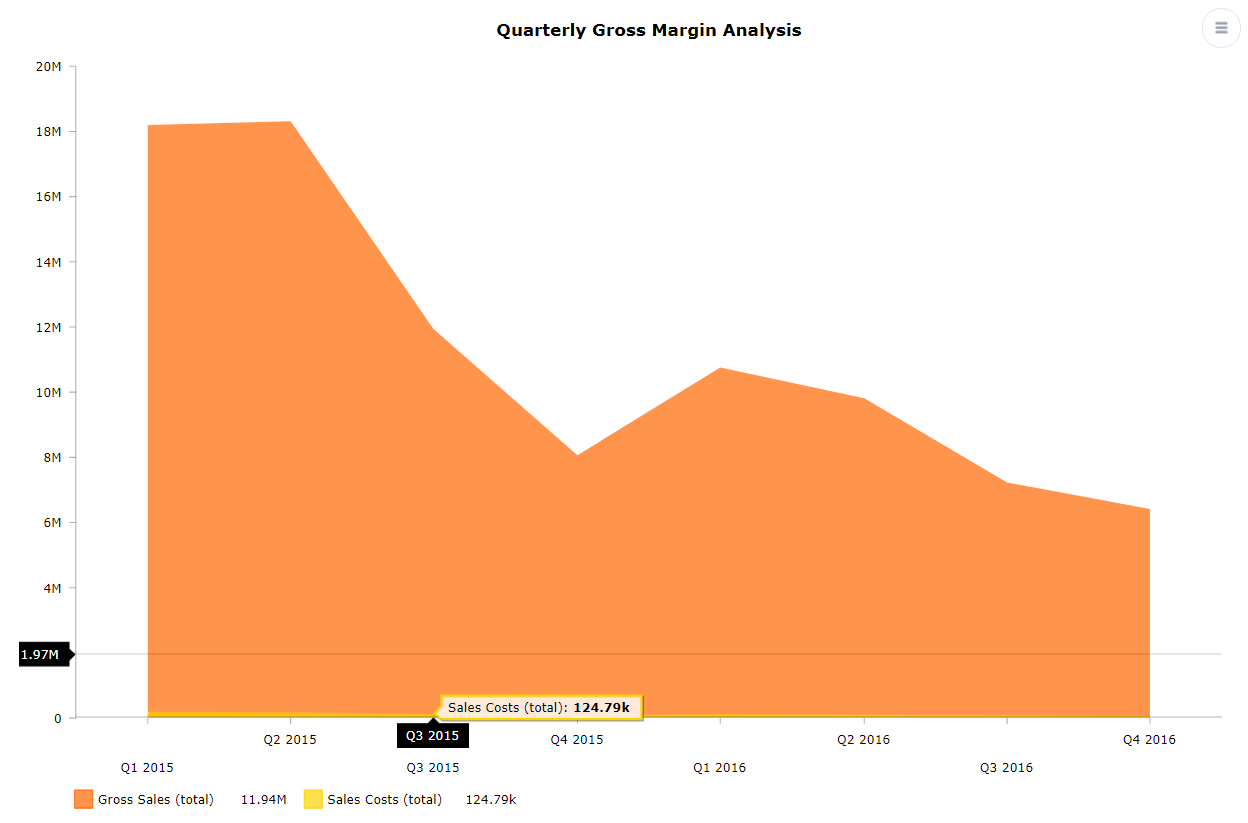
With the logarithmic option applied, you can notice that the Y-axis has changed to a base 10 log scale. The sales costs area is clearly visible, and you can tell how sales costs fluctuate over time.
These examples show the importance of using the logarithmic scale to uncover important insights in the data. By using DataClarity storyboards, you can apply it to your charts with just one click.
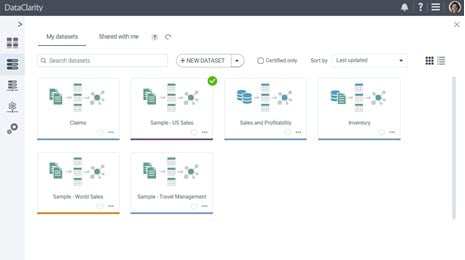
DataClarity storyboards offer numerous capabilities to allow exploring your data for instant answers to your most important questions. You can create stunning analytics from an extensive library of visualizations and widgets, and share insights with others in seconds. Moreover, you can utilize any combination of visualizations, web content, graphics, and analytics from multiple vendors to create a unified user experience. To learn more about how you can empower your users with unified business views of your data, please visit DataClarity Analytics and Data Science platform microsite.
You might also be interested in…
-
 Releases
See What’s New in DataClarity 2023.5

The newest release of DataClarity is here! DataClarity 2023.5 brings many innovations and enhancements to make analytics in your organization more powerful and seamless. -
Release Notes
DataClarity 2023.5 Release Notes
Check out DataClarity 2023.5 covering the latest features including support for Trino database connections, in-product notifications for shared content, advanced data filtering, and more. -
 Embedded Analytics
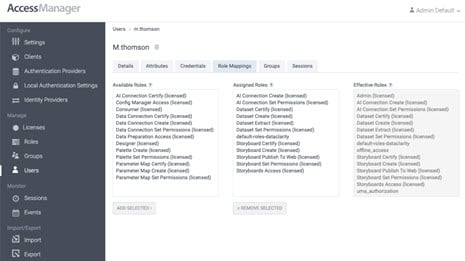
Enterprise Security and Access Management Critical to Embedded Analytics

With the ever-increasing adoption of SaaS applications, more robust security and access management have become paramount, especially for embedded analytics.