Check out the latest features included in DataClarity 2020.9 release! This version brings innovative capabilities such as columns data formatting, custom JavaScript and CSS, an easier way to add new tenants from the Access Management interface, and more.
- Apply number formatting
- Apply date & time formatting
- Rename all columns in a table
- Dataset columns structured in Tableau
- Consistent naming for aggregations
- Rename columns used in calculations
- TM1 Cube View connection details
- Date & number formatting
- HTML code widget
- HTML input widget
- HTML button widget
- Add CSS and JavaScript to a storyboard page
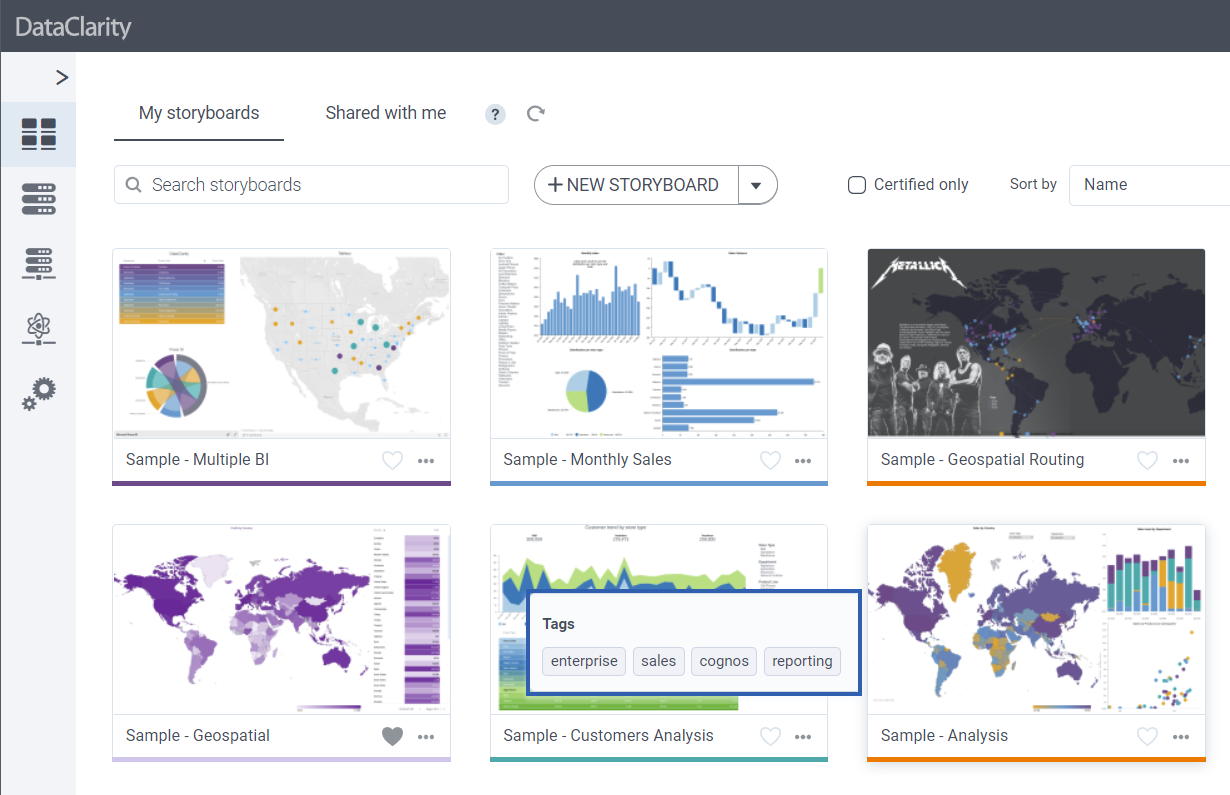
- View storyboards’ recipients in List view
- Filter data by one column in Table
- Clear filter on cell toggle in Table
- Use additional columns for visualization queries
- Other enhancements in Table
- Column search in Filter & Highlighter
- Text & date formats in Single Value
- Consistent naming for aggregations
- Preview a script code
- The default size for some widgets
- Cancel visualizing a widget
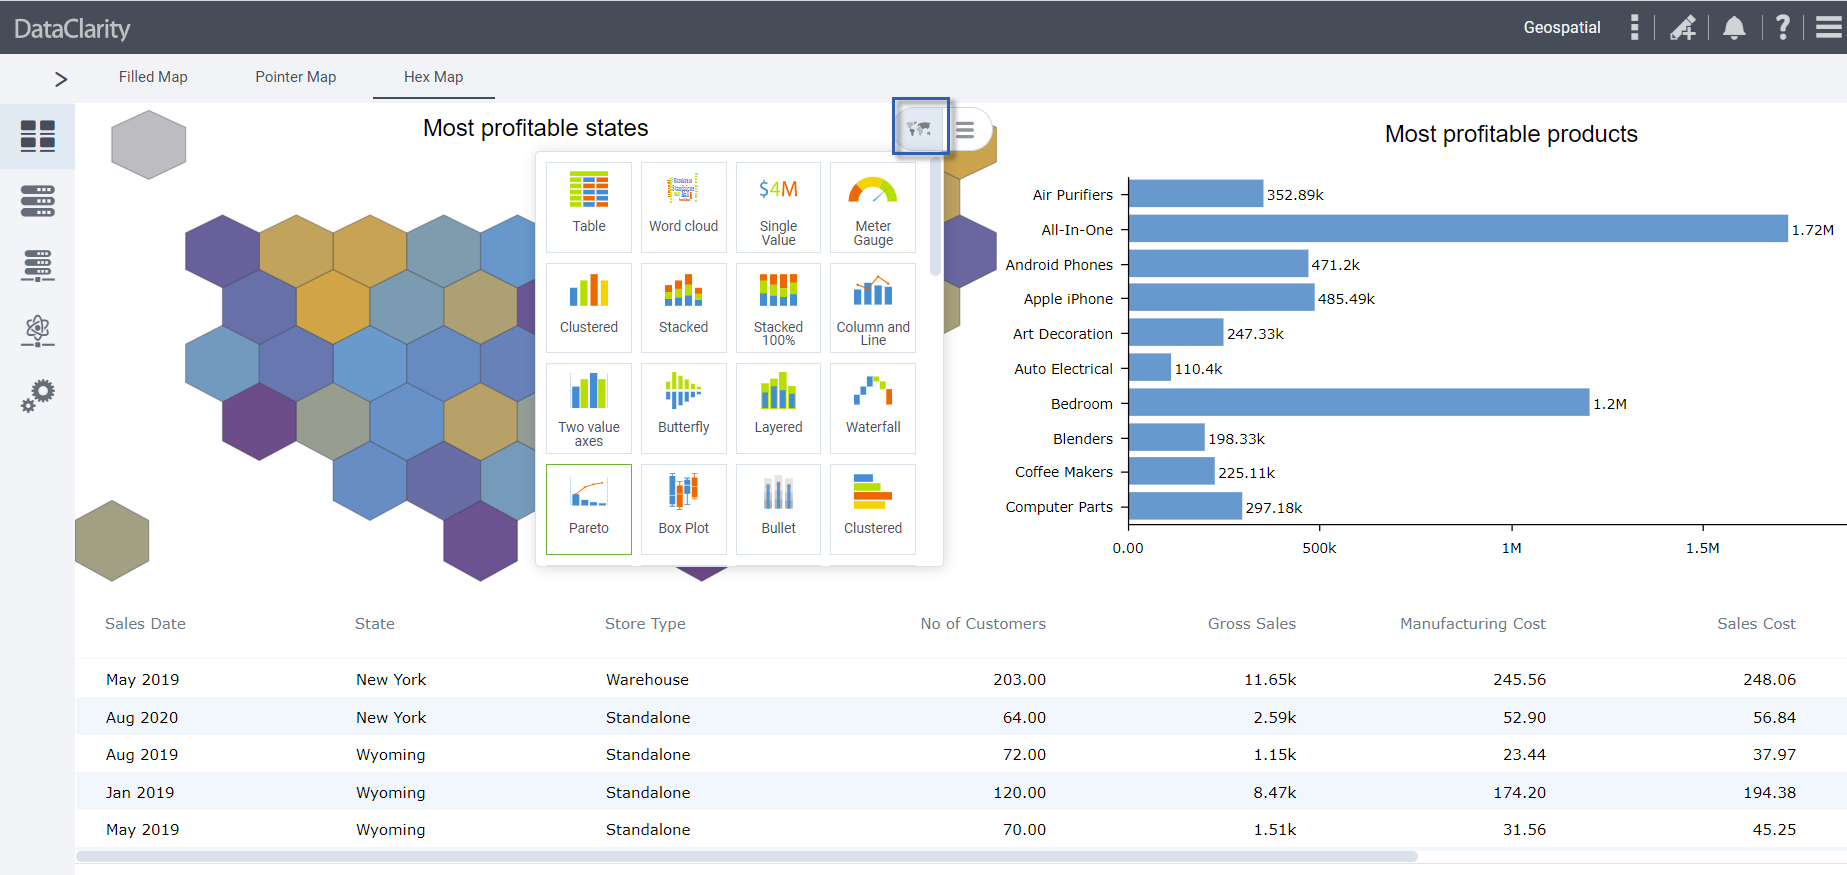
- Percentage sign in Pareto charts
- Deploy custom Python libraries
- Deploy the platform behind the external SSL balancer
- Create a tenant in Access Manager
Related Resources
Videos
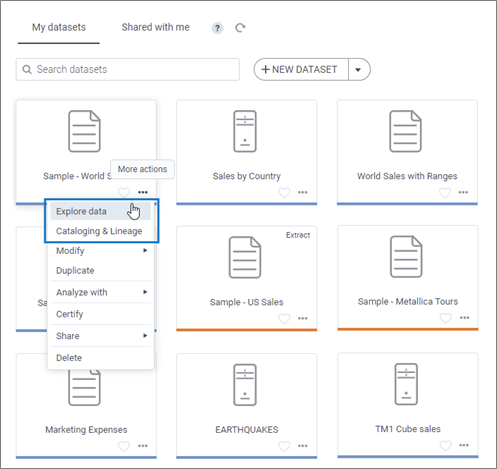
- Create your first dataset
- How to explore a dataset
- How to add filters to a dataset
- How to add calculations to a dataset
- How to add a data connection
- How to configure datasets caching
- How to use built-in data science functions
- Get started with storyboards
- Create your first storyboard
- How to share a storyboard
- How to publish a storyboard to web
- How to add interactive visualization filters
- How to add data filters to a visualization
- How to filter visualizations using actions
- How to customize visualizations
- How to add interactivity between widgets
- How to create a path map visualization
DataClarity Releases
- All Latest DataClarity Releases
- All New DataClarity 2023.3
- Discover DataClarity 2023.2
- Meet DataClarity 2023.1
- What’s New in DataClarity 2022.6
- Discover DataClarity 2022.5
- Meet DataClarity 2022.4
- All New DataClarity 2022.3
- What’s new in DataClarity 2022.2
- Discover DataClarity 2022.1
- Meet DataClarity 2021.4 & 2021.3
- All New DataClarity 2021.2
- DataClarity 2021.1 is here
- What’s new in DataClarity 2020.10
- Meet DataClarity 2020.9
- Discover DataClarity 2020.8
- All New DataClarity 2020.7
- DataClarity 2020.6 is here
- Meet DataClarity 2020.5
- Discover DataClarity 2020.4
- DataClarity 2020.3 is Here
- Meet DataClarity 2020.2
- DataClarity 2020.1 Features
Online Help
Solution Briefs
Web Pages
Viz Gallery
Analyst Reports
- Eckerson Group Report: DataClarity Product Profile
- How to Succeed with Self-Service Analytics eBook
- Data and Analytics Integration Hubs eBook
Technical Specifications
Blog Articles
- What’s New in DataClarity 2020.6
- Meet DataClarity 2020.5
- Unifying Analytics Across Disparate BI Tools
- Unifying Disparate Data Sources
- The Modern Way to Manage Disparate BI and Data Environments
- DataClarity 2020.4 is here
- Discover DataClarity 2020.2
- What’s New in DataClarity 2020.1?
- Prepare for Data Preparation
- Fostering a Data Science Culture Throughout Your Organization
Featured Webinars