Your data is geographically distributed, and you want to visualize at least two metrics in your data? The pointer map might be a good choice.
The pointer map, also known as a “bubble map” or “symbol map”, has markers placed over geographical locations. Pointer maps can show two quantitative values — one by varying the size of the marker and the other one by varying the color — simultaneously, in a single visualization.
If you need to show more measures, you can easily incorporate additional metrics in the tooltips that appear when you point to the markers. Keep in mind that pointer maps should not contain too many geographical points to avoid overcrowding of markers and, thus, be unreadable. It is a good practice to apply a bit of transparency for the color palette, allowing you to see the bubbles overlapping.
The following example of a pointer map shows number of customers and gross sales in different cities in North America:
- The marker size varies based on the number of customers in a location. The larger data points represent a larger number of customers.
- The color represents the gross sales value: red is the lowest value and green are the highest. You might also choose the sequential palette type that is using one color with a gradient effect to show values progression.

Location geocoding
A dataset to be visualized in a pointer map should contain some sort of geographical dimensions. Those can be countries, cities, addresses or the exact coordinates with the latitude and longitude data. Geocoding is the translation process of your geographical data into the points with latitude and longitude on a map visualization.
When preparing your data for analysis, consider the following aspects of geocoding: place names and coordinates.
Place names
The DataClarity engine automatically translates location names or addresses into points on the map. Depending on the level of detail, you may want to specify more “context” by adding more location data to get the best geocoding results.
Let’s say you want to visualize cities in several countries. You can plot the markers based on the City dimension only, but the engine translates the cities based on their rank. For example, Paris will be plotted in France. Including both Country and City will provide more context and improve the translation results. If your dataset has “Paris, France” and “Paris, USA”, they will be plotted appropriately.
Coordinates
Your location data may contain the exact geographical coordinates: one column (latitude & longitude or longitude & latitude) or two columns (one for latitude and one for longitude).
Before visualizing a map, ensure that you apply a corresponding geographical role to the column(s) you dropped into the Location field of the widget. DataClarity plots markers for the geographical coordinates on the selected map immediately.

Custom images for each location
Imagine the situation where you have a list of sales representatives in each state of the USA and want to place their avatars instead of standard markers. DataClarity pointer map allows you to show unique images for each point plotted on a map. What you need to do is just update your dataset to include the links to corresponding images. Then, you just let the widget know which column contains these links.
For the following map, we’ve added a column called “Avatars” and, for each representative, inserted a link to his/her avatar. Then, in the widget settings pane, we’ve just dropped this column in the Markers field. When using filtering actions, clicking an avatar filters other charts and KPIs for the reps in the storyboard. Awesome, isn’t it?

Another case where you may need different images per location is the weather map: we have used animated SVG images to show weather conditions in different cities.

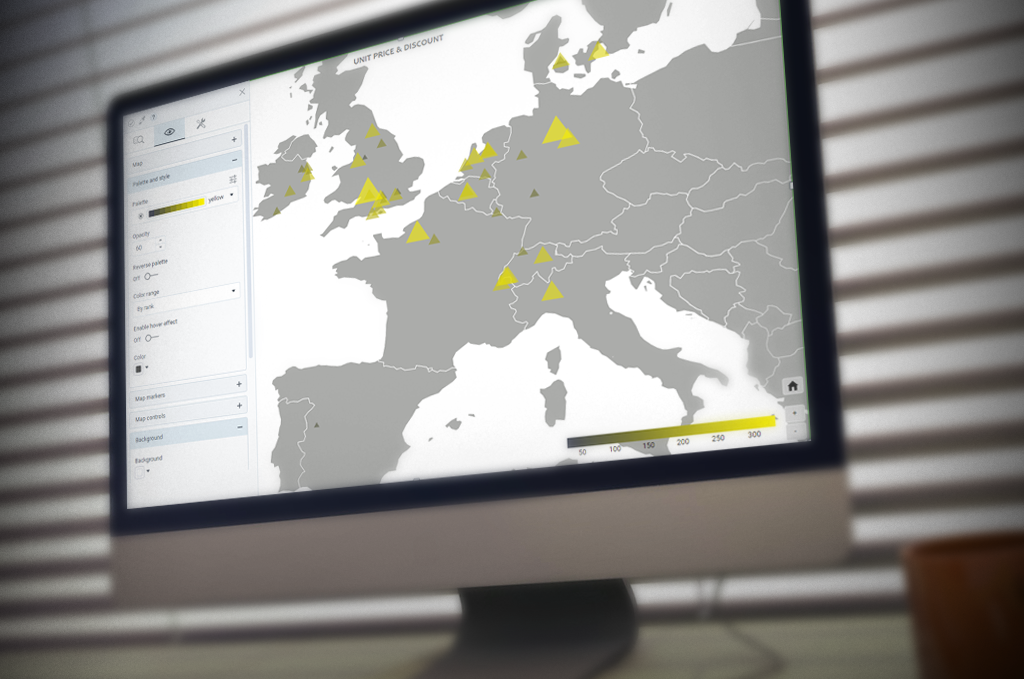
Map styling
DataClarity offers important map appearance settings that allow you to emphasize your insights and deliver the right message:
- Colors for map backgrounds and the map regions – Let’s say you want to visualize countries on the world map, but there are a lot of unused regions where you do not have business data. You can make map background be almost invisible and avoid distraction.
- Color palettes – If you do not find the colors you need in the standard palettes, do not hesitate to create your own by using the colors that correspond to your company branding, for example.
- Color for hover – This feature will help you focus users’ attention in presentation mode: when you point to a marker, its color will change to a different one.
- Zoom controls – As a widget author, you can zoom the map to a certain view and save it in this position. Adding zoom buttons can be handy if users want to navigate your map and zoom in or out other areas.
- Data and location labels, title, and much more – Labels help you communicate the name and the value of each location or region. Tooltips also work well to show extra information and remind the audience what they’re viewing. Labels are more important if consumers do not know about the area you’re mapping.
- Markers – You can choose a marker icon from different shapes or default icons, or even upload your own image.

Pointer maps may be a good choice for your geographically distributed data, but don’t hesitate to check out DataClarity’s extensive library of visualizations and widgets to find your perfect match.
DataClarity Storyboards has made it very simple to visualize the data in just a few clicks for instant answers to your most important questions. You can create stunning interactive analytics and share insights with others in seconds. Moreover, you can combine analytics, visualizations, and web content from multiple sources to create unified user experiences.
To learn more about how to use data and analytics for a competitive advantage, please visit our DataClarity Analytics and Data Science platform microsite.